
The US Energy Flow infographic, at right, is one of the most powerful single images for understanding energy use in the US economy. It has been a staple on my web site for several years, and I use it to as a starting point to explore sustainability challenges and opportunities in the energy economy.
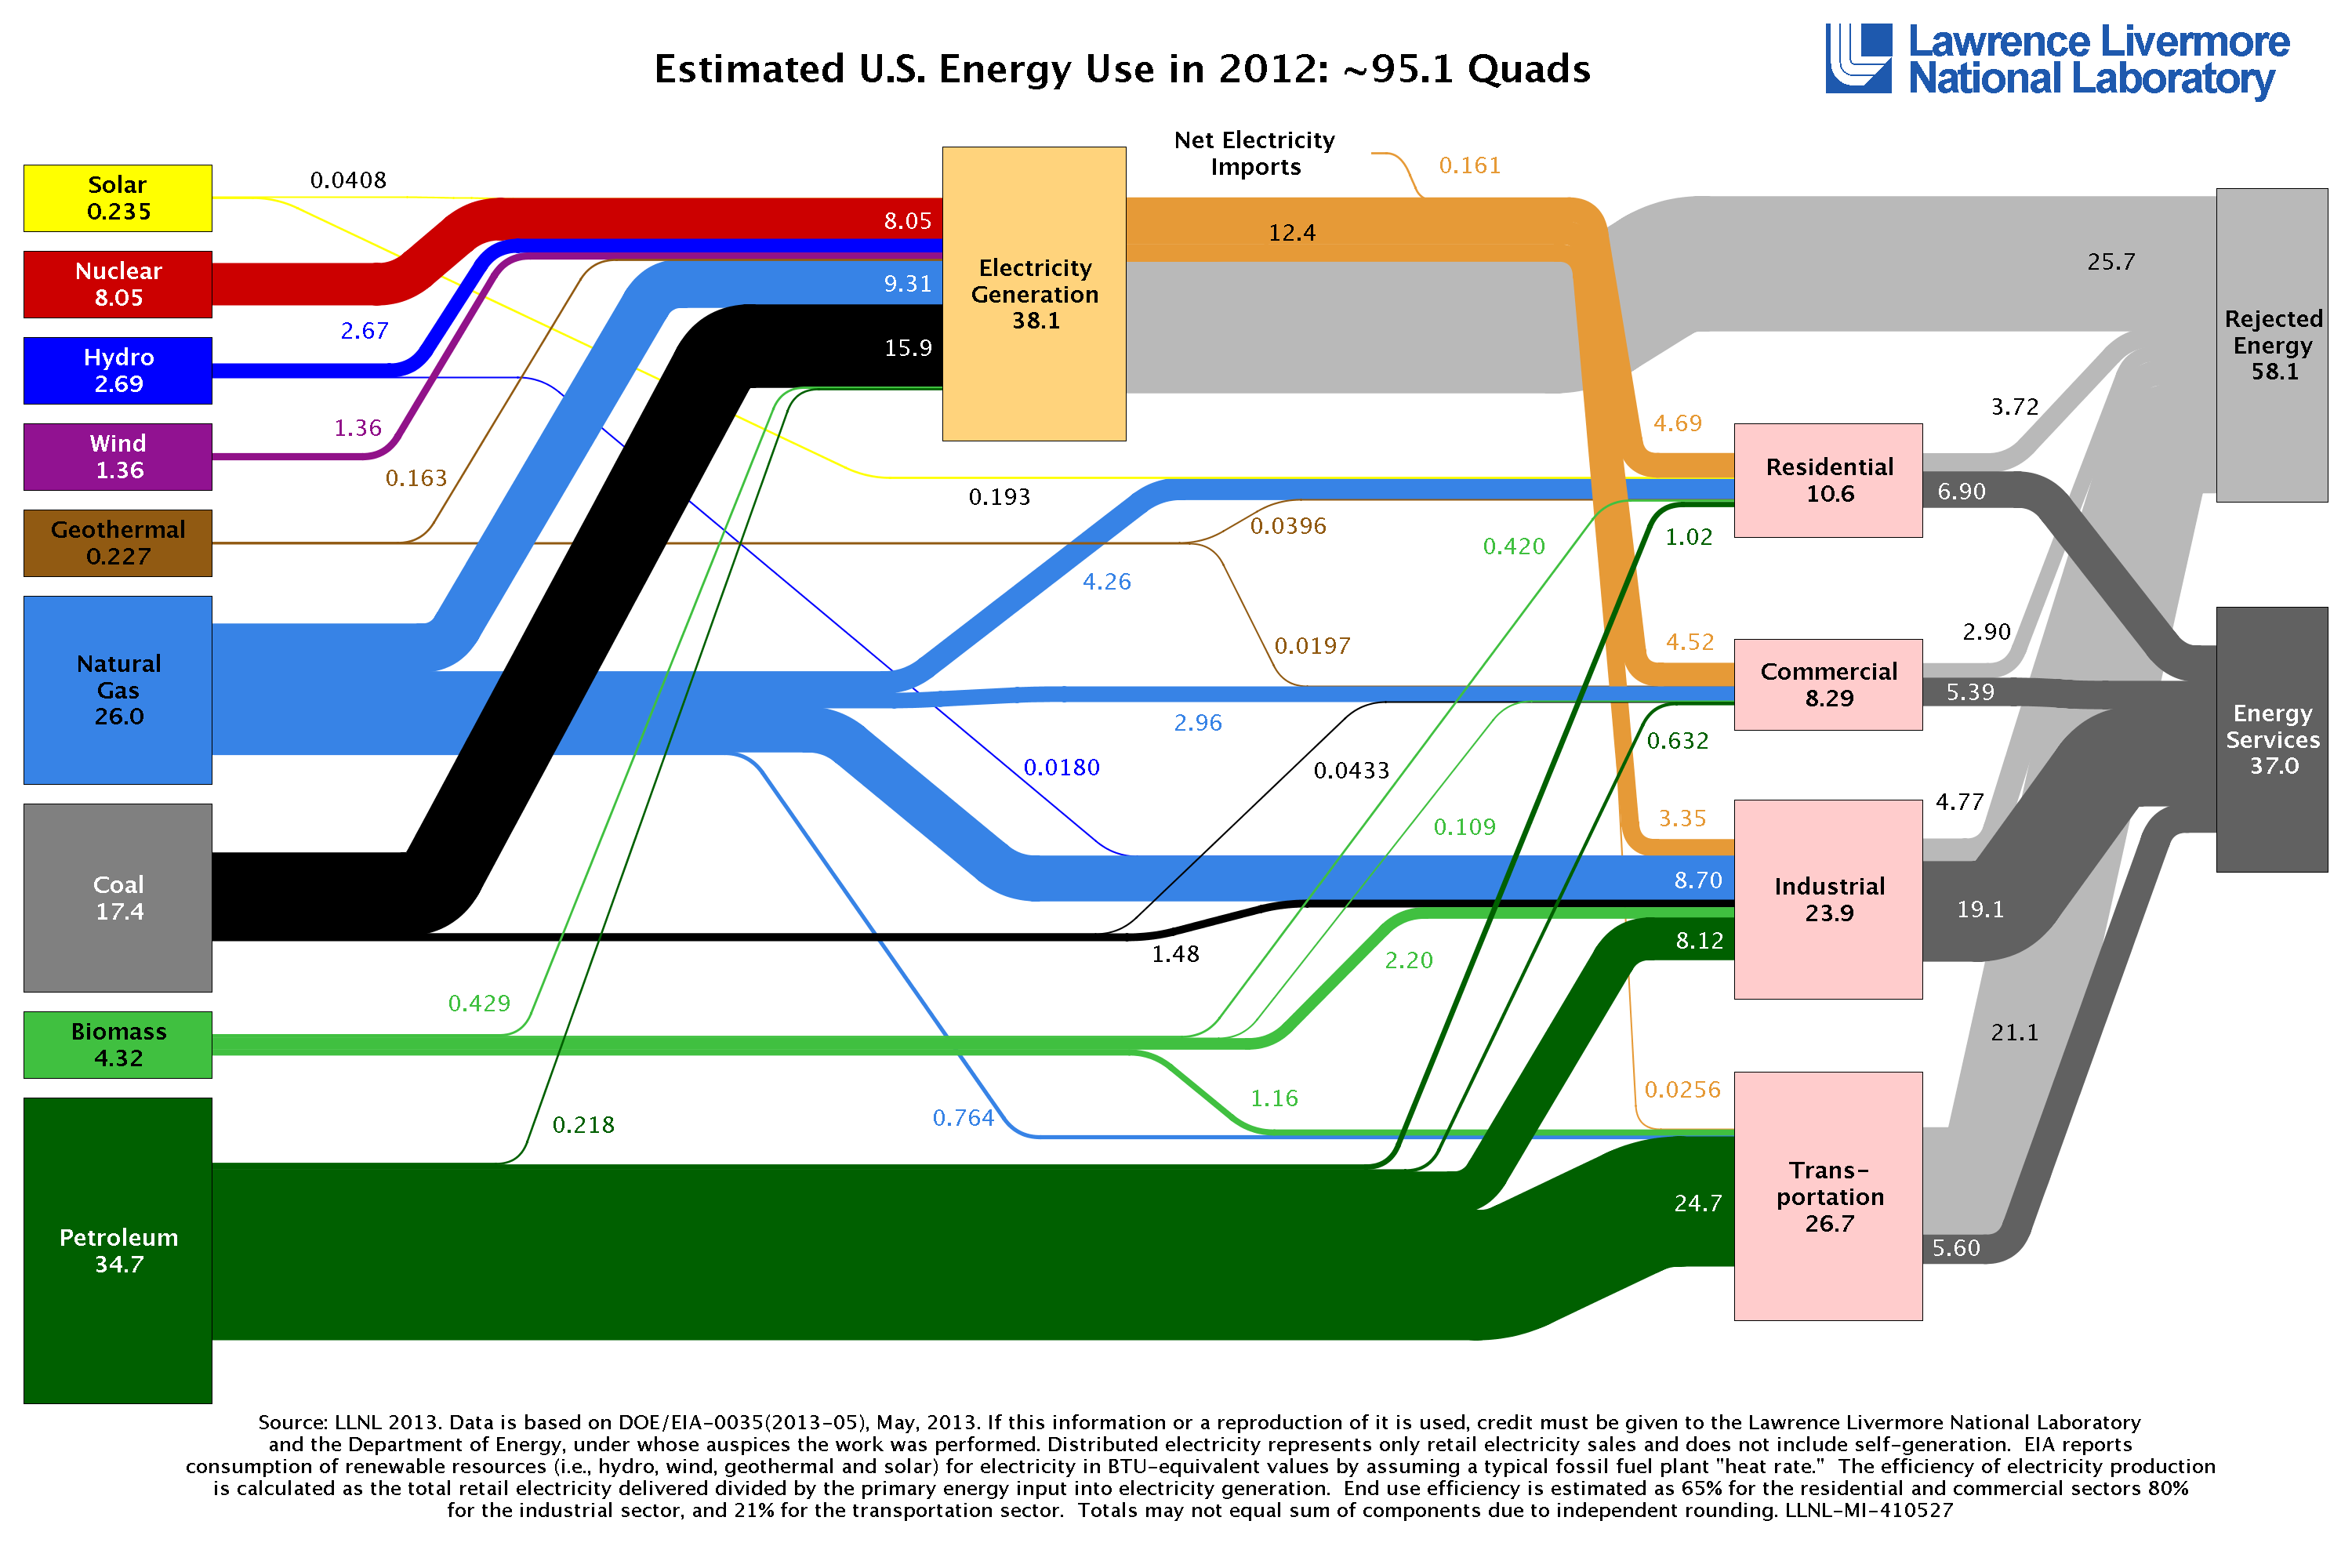
The last four years have seen huge changes in our energy economy – the growth of renewable energy, the rise of natural gas, the decline of coal, increased efficiency in buildings and transportation, and much more. Those changes can be neatly summarized through an analysis comparing the 2012 and 2008 versions of the Energy Flow graphic.
From 2008 to 2012:
- The US economy has become more efficient, reducing total energy use by 4%[1].
- Despite the natural gas boom, total fossil fuel use (coal, natural gas and oil) is down 6%.
- We are reducing our use of the dirtiest fossil fuels (coal and oil):
- Energy from coal is down 22%
- Energy from oil is down 6%
- 55% of our energy in 2012 came from coal and oil, down from 60% in 2008.
- The US now generates 9.3% of its energy from renewable sources of all kinds (wind, solar, geothermal, hydro and biomass), up from 7.3% in 2008.
- Wind and solar have grown dramatically, increasing 266% since 2008. Together, wind and solar now generate 1.7% of our energy, up from 0.6% in 2008. The total is still small, but capturing 1% of the total energy generated in the world’s largest economy over 4 years in a challenging economic environment without a national energy policy is a significant accomplishment.
It’s not a stretch to imagine that these trends could continue for the next four years. Continuation doesn’t require any heroic assumptions (major technology breakthroughs, a national energy policy). Looking forward, what would the landscape look like in 2016, if these basic trends[2] continue? In 2016:
- The US would generate 13.2% of its energy from renewable sources of all kind.
- Use of coal and oil would slip below 50%, to 48%.
- Wind and solar would generate 4.6% of our energy.
These shifts may seem modest, especially when viewed against the changes that may be required to respond to global climate change. But these are substantial shifts for a huge economy like ours. The needle is moving, and there will be a significant impact on the companies and industries involved even at the current rate of change.
References:
- ↑ For those concerned about the impact of the global financial meltdown and recession on these numbers, it should be noted that the US economy grew 10.4% during that period. US GDP increased from 14,720 billion to 16,245 billion between 2008 and 2012.
- ↑ These are the assumptions used:
- Energy efficiency continues to increase (another 4% reduction in total energy generated), with the additional savings further displacing the use of coal, oil and nuclear.
- Natural gas use increases while coal and oil use decrease as they have from 2008-2012.
- Wind and solar continue to grow at a similar rate.
Pingback:Myth Busters at the Wall Street Journal? «